Analytics
Overview
Various details of every CubeSERV (i.e., WMS, WMTS, WFS, OGC API, etc.) request are logged in a local MySQL/MariaDB database called "cw_audit". This database can be used to monitor the CubeSERV activity for analytics and auditing purposes, and to monitor the health of the system.
CubeWerx Stratos Analytics is a web app for viewing this database. It allows the user to select various views and filters in order to present the data in many different ways.
Administrator privileges are required to access CubeWerx Stratos Analytics. If you're logged in as an Administrator, it will be shown as an option on the left side of the main CubeWerx Stratos Dashboard. It can also be accessed directly via the URL "cubewerxStratosDeployment/audit" (where you'll be prompted for a username and password if necessary).
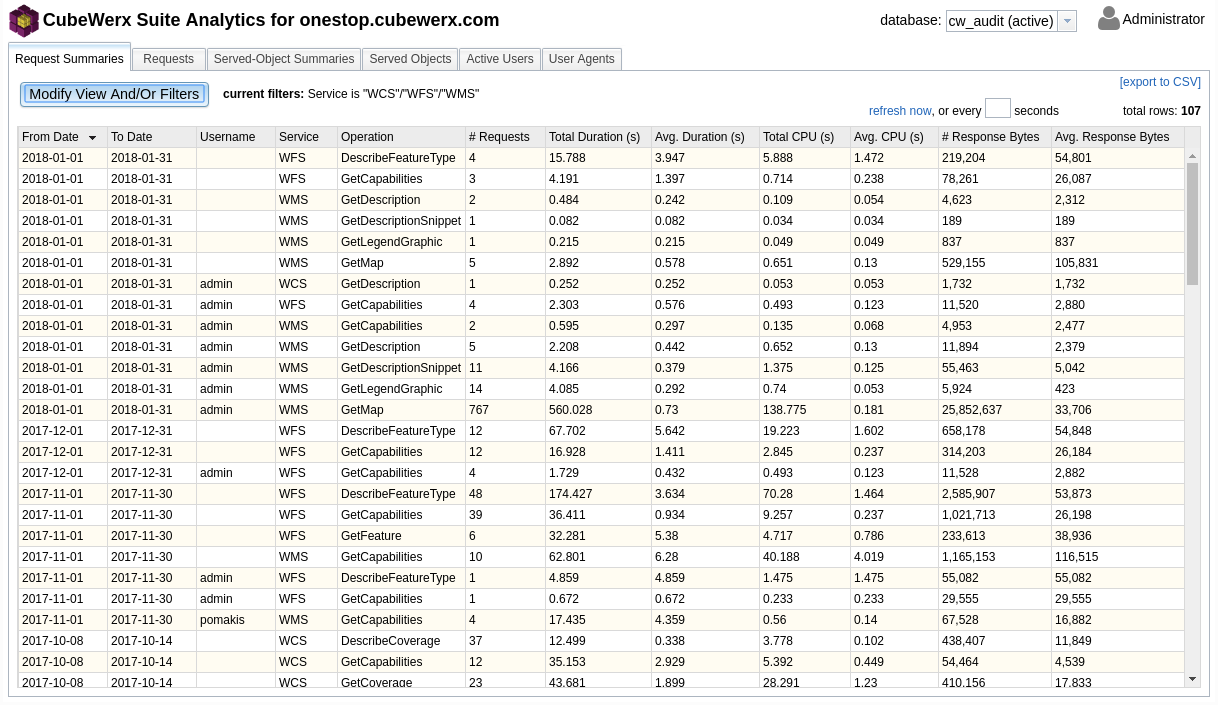
At the top right of the app, next to the sign-in controls, is a database selector. By default, the active "cw_audit" database is selected. However, it is also possible to select an archived database. Older entries in the active "cw_audit" database can be periodically archived in order to keep the database to a reasonable size.
The current time in the server's time zone is also shown in the rop right corner. The dates and times logged by CubeWerx Stratos Analytics are always with respect to the server's time zone.
The app consists of six tabs, each representing a different database view. Each tab has a similar layout, consisting of a table and a few controls at the top. The settings of these controls are maintained independently for each tab. Let's look at each of these components in turn.
the table - The primary component of each tab (except the "Report" tab) is a table that displays the records of that tab's database view according to the currently-specified view and filter(s). A scrollbar is provided for navigation through a large number of rows. The table can be forward- or reverse-sorted by any column simply by clicking on that column's header. The width of each column can also be adjusted by dragging the column separator in the header row. In some tabs, right-clicking on a row brings up a context-sensitive menu for that row.
the "Modify View And/Or Filters" button - This is the most powerful aspect of CubeWerx Stratos Analytics, allowing the user to customize the way the data in the current tab is presented. It presents the full list of available columns, allows the user to show or hide them individually, and allows the user to specify filters on each of them, so that only the rows that match the filter(s) are displayed. In the "Request Summaries" and "Served-Object Summaries" tabs, some of the columns are indicated as being key fields. When a key field is hidden, the rows distinguished by this field will be merged into a single row. For example, if the "Username" column is shown, then the summaries table will provide summaries for each distinct username. However, if it is hidden, then the summaries table will not distinguish between usernames and will provide higher-order summaries independent of username. A filter can be applied to a column even if it is a key field and/or is hidden, allowing for a very flexible view customization.
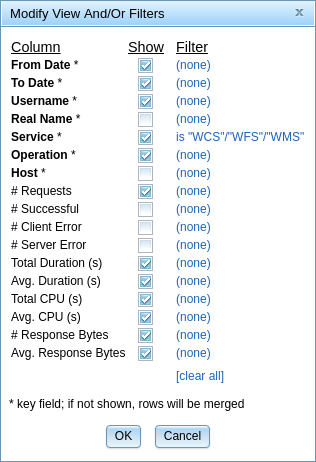
Each filter has its own dialog, providing a filter-specific editor for each column. The dialogs of individual filters have an "enable filter" toggle, allowing the user to quickly disable or re-enable a filter. The main Modify View And/Or Filters" dialog also provides a "clear all" button, allowing a user to quickly disable all filters. Modifications to the view and/or filters are not applied to the displayed table until the user selects "OK" on the "Modify View And/Or Filters" dialog. Selecting "Cancel" will discard any modifications.
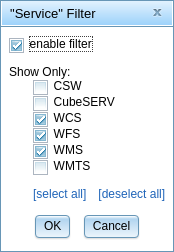
the "current filters" indicator - The "current filters" indicator lists the currently-applied filters so that's it's always clear what the table represents.
the refresh controls - Unless an archived database is selected, the presented data is live. The user has the option of refreshing the view at any time by pressing the "refresh now" button, or of automatically refreshing the view on a regular basis by entering the desired refresh period (in seconds) into the "every ___ seconds" field. The view is also automatically refreshed whenever the user switches tabs.
the "total rows" indicator - This is an indicator of the total number of rows that matches the current view and filter(s).
the "export to CSV" button - At any time, the currently-displayed table, with the current view and filter(s) applied, can be exported to a comma-separated-values (CSV) file by pressing the "export to CSV" button. This CSV file can be imported into spreadsheet applications such as Microsoft Office for further analysis or for report generation.
The "Request Summaries" Tab
The "Request Summaries" tab summarizes the requests according the specified view and filter(s). The requests are summarized at the time granularity specified by the "audit.requestSummaries.granularity" configuration parameter, which is typically set to monthly.
The following columns are available:
From Date - The minimum date (inclusive) of the time duration summarized by the row. The value is bound by the configured granularity. This is a key field, but operates in conjunction with the "To Date" field. If both fields are hidden, then each row represents the entire timespan of the database.
To Date - The maximum date (inclusive) of the time duration summarized by the row. The value is bound by the configured granularity. This is a key field, but operates in conjunction with the "From Date" field. If both fields are hidden, then each row represents the entire timespan of the database.
Username - The authenticated username of the user who initiated the requests summarized by the row. If the user has been authenticated through OpenID Connect, this is the user's OpenID Connect "sub" claim; otherwise (i.e., if the user has been authenticated through CubeWerx's CwAuth mechanism), this is the user's CwAuth username. An empty value indicates an unauthenticated user. This is a key field, so if it's hidden then each row represents requests of all users (authenticated or not).
OID Issuer - If the user has been authenticated through OpenID Connect, this is the issuer URL of the OpenID Connect server; otherwise (i.e., if the user has been authenticated through CubeWerx's CwAuth mechanism), this is empty. This is a key field, so if it's hidden then possibly-distinct OpenID Connect users that happen to have the same "sub" claim will be represented by the same row.
Real Name - The real name (typically the first and last name) of the user who initiated the requests summarized by the row. This can be empty if unknown.
Service - The OGC Web Service invoked by the requests summarized by the row. For OGC API requests, the equivalent OGC Web Service is recorded. This is a key field, so if it's hidden then each row represents requests of all services (although note that summaries are typically broken down by Operation as well).
Operation - The OGC Web Service operation invoked by the requests summarized by the row. For OGC API requests, the equivalent OGC Web Service operation is recorded. This is a key field, so if it's hidden then each row represents requests of all operations.
Host - The hostname that the requests were directed to. This is typically the same for all requests, but can be used to distinguish between virtual hosts. Multiple values would also exist if DNS aliases are configured in order to allow more efficient tile access. This is a key field, so if it's hidden then each row represents requests to all hosts of the machine.
# Requests - The number of requests summarized by the row.
# Successful - The number of requests that were considered successful (i.e., that resulted in an HTTP status of less than 400).
# Client Error - The number of requests that resulted in an error that's considered the fault of the client (i.e., that resulted in an HTTP status between 400 and 499).
# Server Error - The number of requests that resulted in an error that's considered the fault of the server (i.e., that resulted in an HTTP status between 500 and 599).
Total Duration (s) - The sum of the real-time durations of the requests summarized by the row, expressed in seconds.
Avg. Duration (s) - The mean average of the real-time duration of each request summarized by the row, expressed in seconds.
Total CPU (s) - The total CPU time used by the requests summarized by the row, expressed in seconds.
Avg. CPU (s) - The mean average CPU time used by each request summarized by the row, expressed in seconds.
# Response Bytes - The total number of response bytes (including MIME headers) that were sent in response to the requests summarized by the row. This is technically the number of response bytes that were sent between the service and Apache; the number of bytes actually sent out to the client by Apache may differ slightly
Avg. Response Bytes - The mean average of the number of response bytes (including MIME headers) that were sent in response to each request summarized by the row.
# Processing Units - For future functionality.
Avg. Processing Units - For future functionality.
The "Requests" Tab
The "Requests" tab lists the details of each request that matches the specified filter(s).
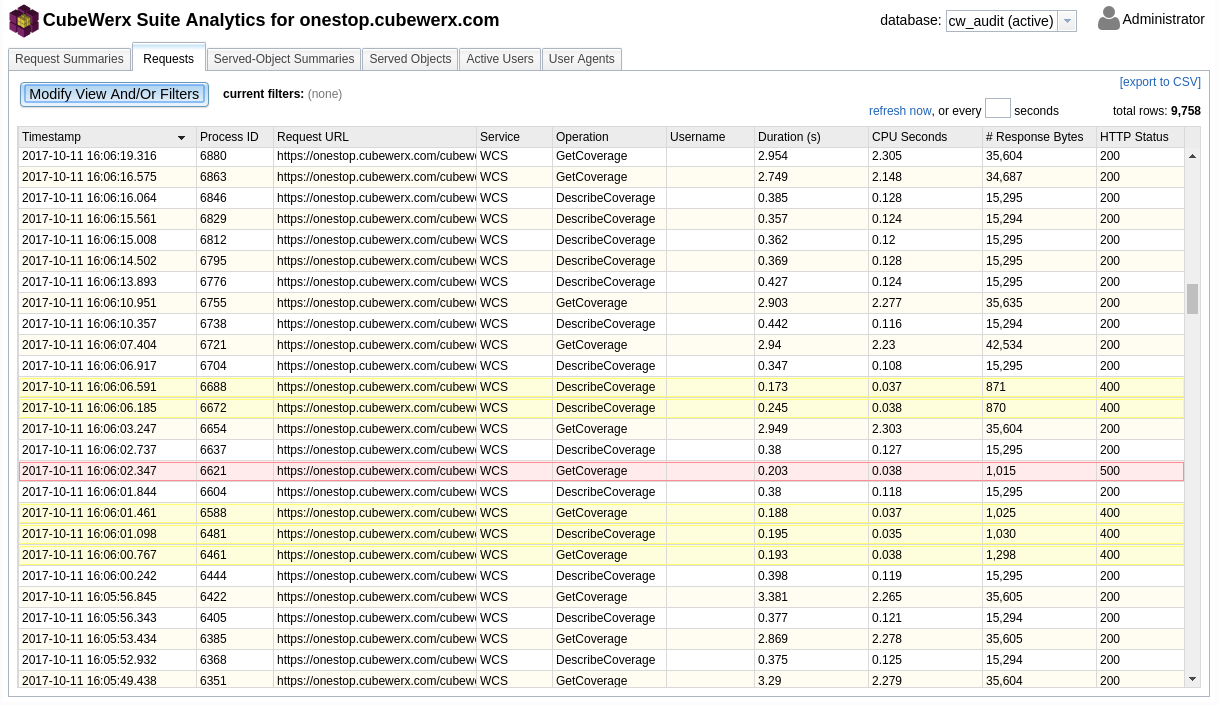
The following columns are available:
Request ID - A unique (to the database) ID for the request. When a request results in a server-side error, the exception report that's returned to the client typically omits all details and simply provides a reference number. This reference number is actually the Request ID.
Timestamp - The time (to the millisecond) that the request was received by the server, according to the server's clock and with respect to the server's time zone.
Process ID - The process ID (PID) of the process that handled the request. This can be useful for correlating with the HTTP logs.
Request URL - The full URL of the request. Request bodies (if any) are not logged.
Request Method - The HTTP method (e.g., GET, POST, etc.) of the request.
Host - The hostname that the request was directed to. This is typically the same for all requests, but can be used to distinguish between virtual hosts. Multiple values would also exist if DNS aliases are configured in order to allow more efficient tile access.
Instance - The CubeSERV instance invoked by the request. An empty value indicates the default instance.
Service - The OGC Web Service invoked by the request. For OGC API requests, the equivalent OGC Web Service is recorded.
Operation - The OGC Web Service operation invoked by the request. For OGC API requests, the equivalent OGC Web Service operation is recorded.
Client IP Address - The IP address of the client that initiated the request. This refers to the direct client, which may be an application or another service.
User IP Address - The IP address of the end user that initiated the request, or that the request is being made on behalf of by an application or another service. This information isn't always available, and is determined on a best-effort basis. An empty value indicates that it could not be determined.
User Agent - A string indicating the user agent of the request. This information is gathered from the request's User-Agent header.
Origin - The origin of the request, as defined by RFC 6454. This is useful for determining appropriate Cross-Origin Resource Sharing (CORS) rules.
Username - The authenticated username of the user who initiated the request. If the user has been authenticated through OpenID Connect, this is the user's OpenID Connect "sub" claim; otherwise (i.e., if the user has been authenticated through CubeWerx's CwAuth mechanism), this is the user's CwAuth username. An empty value indicates an unauthenticated user.
OID Issuer - If the user has been authenticated through OpenID Connect, this is the issuer URL of the OpenID Connect server; otherwise (i.e., if the user has been authenticated through CubeWerx's CwAuth mechanism), this is empty.
Real Name - The real name (typically the first and last name) of the user who initiated the request. This can be empty if unknown.
API Key - The API key (if any) that was used.
Duration (s) - The real-time duration of the request, expressed in seconds.
CPU Seconds - The CPU time used by the request, expressed in seconds.
# Response Bytes - The number of response bytes (including MIME headers) that were sent in response to the request. This is technically the number of response bytes that were sent between the service and Apache; the number of bytes actually sent out to the client by Apache may differ slightly.
Job ID - The ID of the resulting job if this is a successful WPS Execute (or equivalent OGC API) request, or emptuy otherwise.
# Processing Units - For future functionality.
HTTP Status - The resulting HTTP status of the request. An HTTP status of less than 400 indicates that the request was successful, an HTTP status between 400 and 499 indicates a client-side error, and an HTTP status between 500 and 599 indicates a server-side error. If the HTTP status is 0, then the request is either still in progress or has aborted prematurely, and has not (yet) been included in the summaries table. Some services, due to their specifications or de-facto expected behaviour, always return an actual HTTP status of 200 (OK), regardless of whether or not the request resulted in an error. This this situation, CubeWerx Stratos Analytics logs the logical HTTP status; that is, the HTTP status that should logically be returned to the client.
The rows in the "Requests" table are color-coded by the HTTP status of the request (regardless of whether or not the HTTP Status column is shown). Yellow indicates a client-side error (i.e., an HTTP status between 400 and 499), red indicates a server-side error (i.e., an HTTP status between 500 and 599), and blue indicates a request that is either still in progress or has aborted prematurely (i.e., an HTTP status of 0). The rows of successful requests alternate between white and pale yellow like the tables in the other tabs.
Right-clicking on a row brings up a context-sensitive menu. One option in this menu is "mark (highlight)", which highlights that row in green. That highlight persists through refreshes and filter adjustments. Another option is "show request details", which brings up a dialog displaying all known details about the request (including an exception report of applicable). A third option is "show exception report", which, for requests that resulted in an an error (either client-side or server-side), displays the exception report (replete with tracing information) describing the error.
On exceptionally busy servers where the logging of individual requests isn't required, this table can be disabled by setting the value of the "audit.requests.enable" configuration parameter to false.
The "Served-Object Summaries" Tab
The "Served-Object Summaries" tab summarizes the served objects according the specified view and filter(s). The served objects are summarized at the time granularity specified by the "audit.servedSummaries.granularity" configuration parameter, which is typically set to monthly.
A served object is a map layer, feature set or coverage that is served to a client in response to a request to one of the CubeSERV services. The served-object-summaries table doesn't distinguish between map layers served by WMS and those served by WMTS as tiles; each tile is considered a separate served layer.
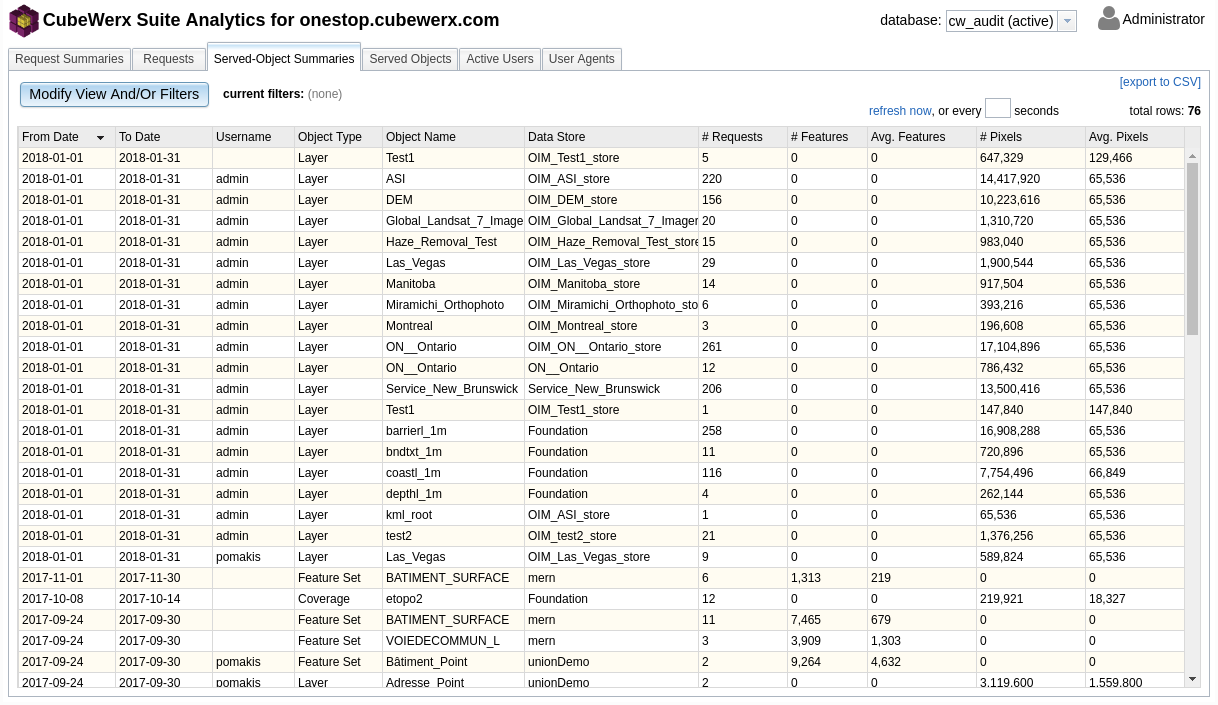
The following columns are available:
From Date - The minimum date (inclusive) of the time duration summarized by the row. The value is bound by the configured granularity. This is a key field, but operates in conjunction with the "To Date" field. If both fields are hidden, then each row represents the entire timespan of the database.
To Date - The maximum date (inclusive) of the time duration summarized by the row. The value is bound by the configured granularity. This is a key field, but operates in conjunction with the "From Date" field. If both fields are hidden, then each row represents the entire timespan of the database.
Username - The authenticated username of the user who received the objects summarized by the row. If the user has been authenticated through OpenID Connect, this is the user's OpenID Connect "sub" claim; otherwise (i.e., if the user has been authenticated through CubeWerx's CwAuth mechanism), this is the user's CwAuth username. An empty value indicates an unauthenticated user. This is a key field, so if it's hidden then each row represents the objects served to all users (authenticated or not).
OID Issuer - If the user has been authenticated through OpenID Connect, this is the issuer URL of the OpenID Connect server; otherwise (i.e., if the user has been authenticated through CubeWerx's CwAuth mechanism), this is empty. This is a key field, so if it's hidden then possibly-distinct OpenID Connect users that happen to have the same "sub" claim will be represented by the same row.
Real Name - The real name (typically the first and last name) of the user who received the objects summarized by the row. This can be empty if unknown.
API Key - The API key (if any) that was used.
Object Type - The type of object (Layer, Coverage or Feature Set) summarized by the row. This is a key field, so if it's hidden then each row represents all object types.
Object Name - The name of the object (with respect to its data store). This is a key field, so if it's hidden then each row represents all objects of the specified object type and data store.
Data Store - The symbolic name of the configured data store that the objects were served from. This is a key field, so if it's hidden then the rows are independent of data store. If two data stores have objects of the same name, then hiding this column would cause those objects to be summarized together.
Host - The hostname that the objects were served from. This is typically the same for all served objects, but can be used to distinguish between virtual hosts. Multiple values would also exist if DNS aliases are configured in order to allow more efficient tile access.
# Requests - The number of served objects summarized by the row. Note that since a layer served in response to a WMS GetMap request can be an arbitrary size, and since each served WMTS tile is logged as a separate served layer, this column isn't ideal for determining served volume. Consider using "# Features", "# Points" or "# Pixels" for this.
# Features - The total number of features served. Note that each served Feature Set can consist of zero or more features, and served Layers and Coverages count as zero features served, so this count is very different from "# Requests".
Avg. Features - The average number of served features; i.e., "# Features" / "# Requests".
# Points - The total number of feature points/vertices served.
Avg. Points - The average number of served feature points/vertices; i.e., "# Points" / "# Requests".
# Pixels - The total number of pixels served. A coverage sample is considered a pixel, and served features count as zero pixels.
Avg. Pixels - The average number of served pixels; i.e., "# Pixels" / "# Requests".
# Nonempty Pixels - The total number of non-empty pixels served. At the moment, this information is only gathered for coverage samples (for the purposes of determining how much actual data was served), and is recorded as zero for everything else.
Avg. Nonempty Pixels - The average number of served non-empty pixels; i.e., "# Nonempty Pixels" / "# Requests".
The "Served Objects" Tab
The "Served Objects" tab lists the details of each served object that matches the specified filter(s).
A served object is a map layer, feature set or coverage that is served to a client in response to a request to one of the CubeSERV services. Map layers are typically served by the WMS or WMTS, feature sets are typically served by the WFS, and coverages are typically served by the WCS. Many requests don't result in a served object (since things like capabilities documents and legend graphics, etc., are not considered objects by CubeWerx Stratos Analytics), while some requests (such as a WMS GetMap request with a layer list of more than one layer) may result in multiple served objects.
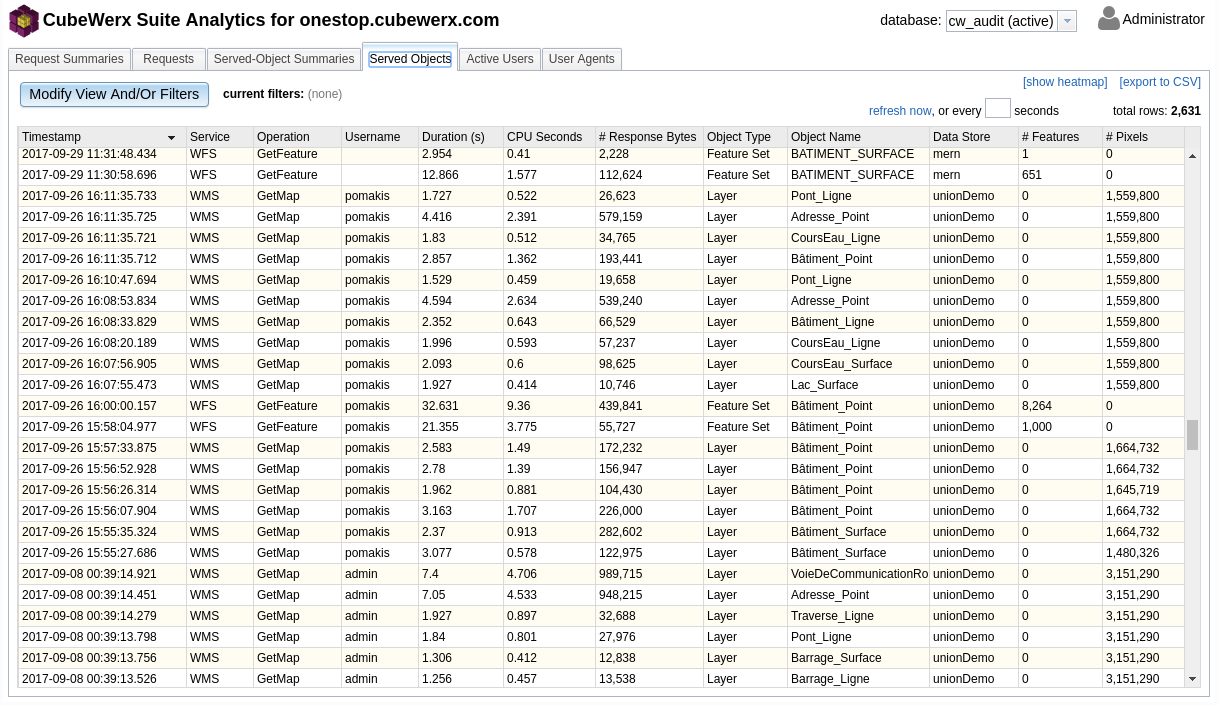
Since each served object is associated with a request, each row of the served-objects table includes all of the information about the request it's associated with. That is, the all of the columns available in the "Requests" tab also exist in the "Served Objects" tab. The following additional columns are available:
Object Type - The type of object (Layer, Coverage or Feature Set).
Object Name - The name of the object (with respect to its data store).
Data Store - The symbolic name of the configured data store that the object was served from.
Style Name - The name of the style that the served object was rendered in, if applicable. An empty value indicates either that the default style was used or that styles are not applicable for this type of object.
Content Type - The Content-Type that the served object was returned as. An empty value indicates that this information is unknown.
Extent Min X - The minimum X value (in the coordinate system specified by the "Extent CoordSys" column) of the extent that was served. For geographic coordinate systems, this represents the minimum longitude.
Extent Max X - The maximum X value (in the coordinate system specified by the "Extent CoordSys" column) of the extent that was served. For geographic coordinate systems, this represents the maximum longitude.
Extent Min Y - The minimum Y value (in the coordinate system specified by the "Extent CoordSys" column) of the extent that was served. For geographic coordinate systems, this represents the minimum latitude.
Extent Max Y - The maximum Y value (in the coordinate system specified by the "Extent CoordSys" column) of the extent that was served. For geographic coordinate systems, this represents the maximum latitude.
Extent Res X - The X resolution (in units/pixel, where the units are in the coordinate system specified by the "Extent CoordSys" column) that was served.
Extent Res Y - The Y resolution (in units/pixel, where the units are in the coordinate system specified by the "Extent CoordSys" column) that was served.
Extent CoordSys - The coordinate system (typically, but not necessarily, represented by its EPSG code) that the object was served in. An empty value indicates that this information is unknown.
Effective Res X - The effective X resolution (in units/pixel, where the units are in the coordinate system specified by the "Extent CoordSys" column) that was served. This differs from the "Extent Res X" column in that it will not report any resolution finer than the native resolution of the data. Therefore, it reports a more accurate measure of the data density that was returned in situations where the served extent is zoomed in past the native resolution of the data.
Effective Res Y - The effective Y resolution (in units/pixel, where the units are in the coordinate system specified by the "Extent CoordSys" column) that was served. This differs from the "Extent Res Y" column in that it will not report any resolution finer than the native resolution of the data. Therefore, it reports a more accurate measure of the data density that was returned in situations where the served extent is zoomed in past the native resolution of the data.
# Features - The number of features served. A feature is only counted as being served if its vector geometry is served, so served Layers and Coverages count as zero features served. A WMS or WMTS GetFeature request can serve features if the CubeWerx-specific GET_GEOMETRIES parameter is specified as TRUE.
# Points - The number of feature points/vertices served.
# Pixels - The number of pixels served. A coverage sample is considered a pixel, and served features count as zero pixels.
# Nonempty Pixels - The number of non-empty pixels served. At the moment, this information is only gathered for coverage samples (for the purposes of determining how much actual data was served), and is recorded as zero for everything else.
Note that since a request may result in the serving of more than object, and may also have performed other activities not related to the serving of the object, the "Duration (s)", "CPU Seconds" and "# Response Bytes" columns (which are request-level columns) may represent a superset of the resources used to serve the object.
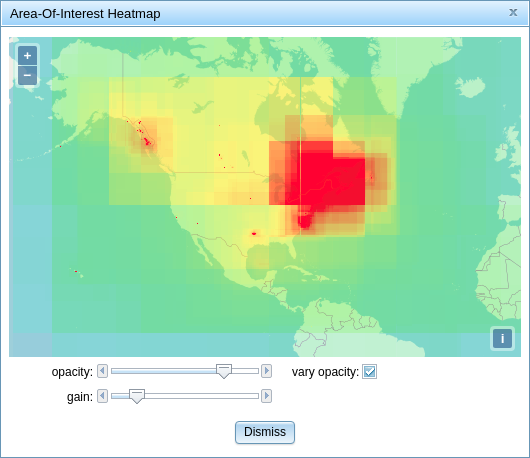
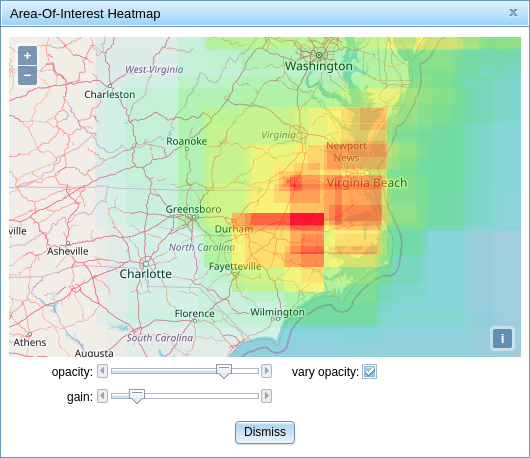
The "Served Objects" tab provides the ability to view a heatmap showing the geographical areas of interest by pressing the "show heatmap" button at the top left corner of the tab. The current filters (if any) are honoured, so a heatmap can be shown for specific users, date ranges, services, data sets, etc., as desired. Using the extent columns as its source of information, it shows the most heavily served areas as red, fading to orange, yellow and green for the lesser-served areas. The map can be panned and zoomed, and the specific colormap used is calibrated individually for each view in order to most clearly display the areas of interest within the view. This automatic calibration is usually sufficient, but the following three manual controls are provided to allow you to bring out more detail in certain situations:
opacity - A slider which allows you to adjust the opacity of the heatmap over the base map.
vary opacity - A toggle which indicates whether or not the transparency of the heatmap should vary geographically based on how "hot" each area is (i.e., with red being more opaque than orange, etc.).
gain - A slider which increases or decreases the weight of the colourmap towards the red ("hot") end of the spectrum.
On exceptionally busy servers where the logging of individual served objects isn't required, this table can be disabled by setting the value of the "audit.servedObjects.enable" configuration parameter to false.
The "Active Users" Tab
The "Active Users" tab provides a list of the currently-active users and their rough level of activity. It can be used, for example, as a measure of how busy the system currently is. The “total rows” indicator at the top right of the tab indicates how many active users there are, and the table provides more detail. By default, a user is considered to be a unique Username / User IP Address pair. That is, two requests from the same authenticated username but originating from two different IP addresses are considered to be two different users. This is especially important for unauthenticated accesses, where no username information is available. It's possible, however, to change the definition of user to distinguish based on just the Username or just the User IP Address by showing or hiding the key fields appropriately.
A user is considered active if he or she has made at least one request within the last n seconds, where n can be specified via the "time window" field. This is a sliding window that always represents the immediate past. Its default size is 300 seconds (5 minutes), but can be changed at any time. All of the data shown in the active-users table represent just the requests that have been made within this window. Like the other tables in CubeWerx Stratos Analytics, it also subject to the specified filters.
By default, the table is refreshed every 10 seconds. However, this can be changed to whatever refresh rate is desired.
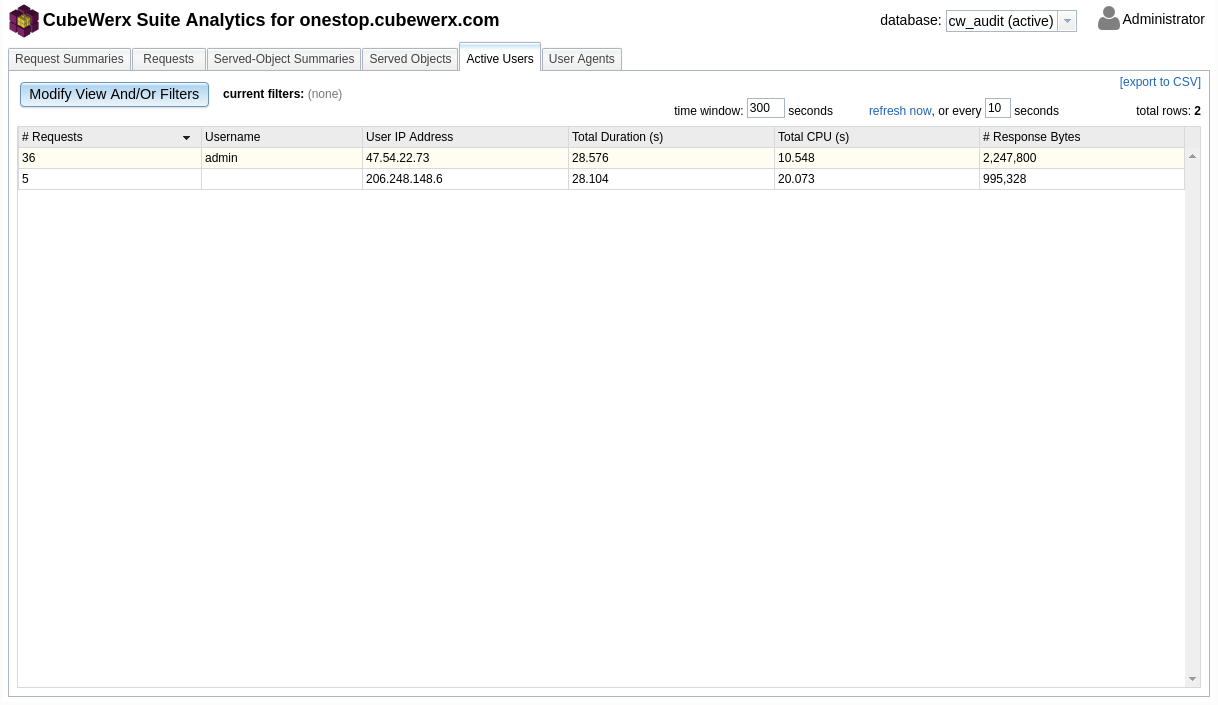
The following columns are available:
# Requests - The number of requests summarized by the row.
Username - The authenticated username of the user who initiated the requests summarized by the row. An empty value indicates an unauthenticated user. If the user has been authenticated through OpenID Connect, this is the user's OpenID Connect "sub" claim; otherwise (i.e., if the user has been authenticated through CubeWerx's CwAuth mechanism), this is the user's CwAuth username. This is a key field, so if it's hidden then it's no longer considered part of the criteria for identifying unique users.
Real Name - The real name (typically the first and last name) of the user who initiated the requests summarized by the row. This can be empty if unknown.
User IP Address - The IP address of the end user that initiated the requests, or that the requests are being made on behalf of by an application or another service. This information isn't always available, and is determined on a best-effort basis. An empty value indicates that it could not be determined. This is a key field, so if it's hidden then it's no longer considered part of the criteria for identifying unique users.
Total Duration (s) - The sum of the real-time durations of the requests summarized by the row, expressed in seconds.
Total CPU (s) - The total CPU time used by the requests summarized by the row, expressed in seconds.
# Response Bytes - The total number of response bytes (including MIME headers) that were sent in response to the requests summarized by the row. This is technically the number of response bytes that were sent between the service and Apache; the number of bytes actually sent out to the client by Apache may differ slightly.
The "User Agents" Tab
The "User Agents" tab provides a summary of the HTTP user agents making the requests.
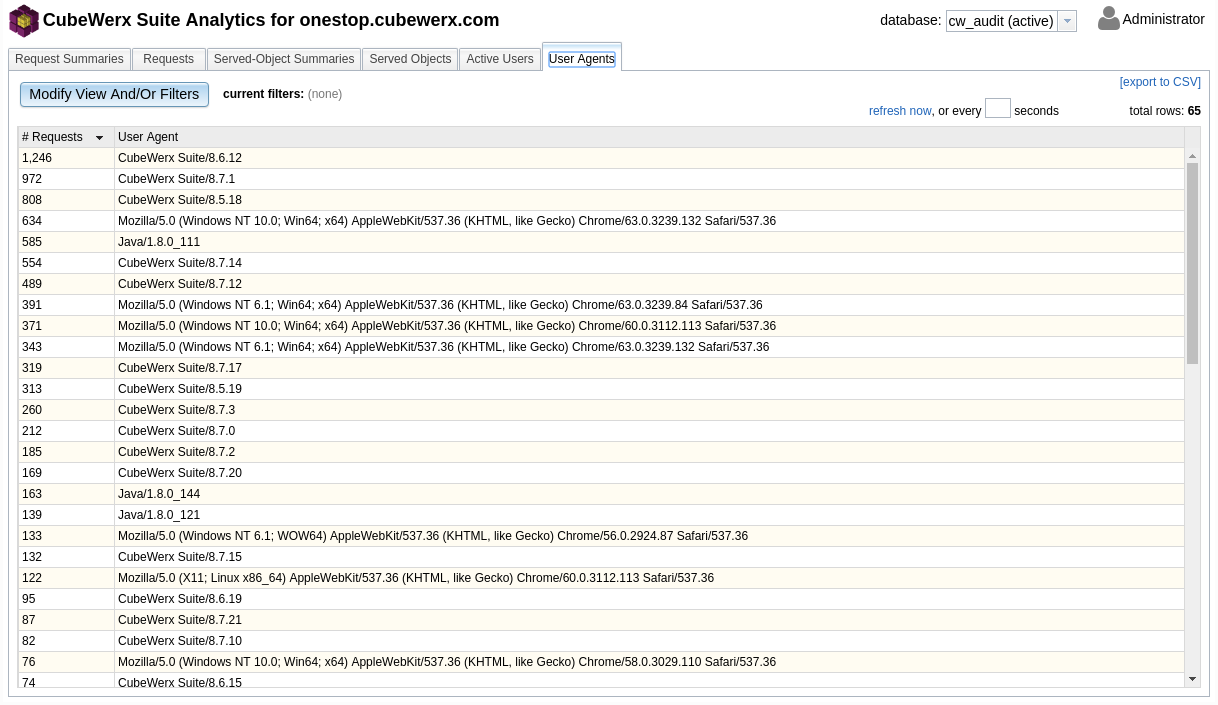
The following columns are available:
# Requests - The number of requests summarized by the row.
User Agent - A string indicating the user agent of the requests. This information is gathered from the requests' User-Agent header.
The "Report" Tab
The "Report" tab provides the ability to generate a multipage report, suitable for generating to PDF and/or printing. The report can be generated for any time range (subject to the value of the audit.summaries.granularity configuration parameter), and for all users or for a specific user. The details of what gets reported are configured with the "audit.report.*" configuration parameters.
Caveats
If the tiles of a data set are publicly accessible (i.e., if the "Secure tiles from public access" checkbox for that data set in OpenImageMap is not checked), then requests to these tiles typically bypass CubeSERV for efficiency, and are therefore not logged. Such requests may trigger an internal WMTS GenTile request when a requested tile has not yet been generated, and these requests are logged. However, since the majority of tile requests go unlogged for publicly-accessible tiles, CubeWerx Stratos Analytics cannot reliably be used to monitor or audit such requests. If monitoring or auditing of such requests is desired, then the "Secure tiles from public access" checkbox for the data set must be selected in order to force all tile requests through CubeSERV (at the cost of efficiency.)
The way asynchronous WCS GetCoverage or WFS GetFeature requests (i.e., those requests whose processing is done offline with the results collected later by the client by means of a separate GetCachedDownload request) are logged deserves some special attention. The number of response bytes logged for these requests is very small because it merely accounts for the acknowledgement message that's returned to the client. Initially the duration and CPU seconds columns will have very small values in them too, but once the preparation of the coverage or feature set is complete these numbers will be updated to reflect the full processing time of the request. However, the number of response bytes will not reflect the size of the resulting coverage or feature set. That's because these objects are not returned directly by the GetCoverage or GetFeature request. When the user (or another user that the original requester may have passed the URL on to) retrieves the resulting coverage or feature set via a GetCachedDownload request, this is logged as a separate request. It is the record for this request that logs the size of the resulting coverage or feature set. This request will also have its own duration and CPU seconds measurements, but these will typically be small because a GetCachedDownload request is mostly just a file transfer. Note that there can be zero or more GetCachedDownload requests for each asynchronous GetCoverage or GetFeature request.
The cwauditadmin Command-Line Tool
The CubeWerx Stratos installation includes a command-line tool called cwauditadmin, used to perform certain administration tasks on the active "cw_audit" database.
cwauditadmin archive to=
This will archive old entries of the audit database into a new database
whose name includes a datestamp to indicate that it's an archive.
It will not remove the archived entries from these active database;
this needs to be done manually with the "clear" operation (see below).
A "to" date needs to be supplied, and needs to be a valid date
for the granularity specified by audit.requestSummaries.granularity
configuration parameter. This granularity is typically "monthly", so
typically you'd need to specify the last day of a month. All entries
up to and including this date are archived. Specifying "yes=true"
bypasses an "are you sure?" prompt for use in scripts.
cwauditadmin clear [to=
This will clear the audit database, or the specified portion of it.
If a "to" date is supplied, all entries up to and including this date
are removed from the database. This date needs to be a valid date
for the granularity specified by audit.requestSummaries.granularity
configuration parameter. This granularity is typically "monthly", so
typically you'd need to specify the last day of a month. If no "to"
date is supplied, the entire database is cleared. Specifying "yes=true"
bypasses an "are you sure?" prompt for use in scripts.
cwauditadmin cull [yes=true]
This will archive or clear old requests entries (based on the values
of the audit.keepRequestRecordsFor and audit.autoArchive.frequency
configuration parameters). Specifying "yes=true" bypasses an "are you
sure?" prompt for use in scripts.
A standard CubeWerx Stratos installation has a cron job installed which automatically calls this operation nightly, so it typically isn't necessary to do this manually.
cwauditadmin listDatabases [format=text|json|simple]
This will list the existing CubeWerx Stratos Analytics
databases, including the active one. For example, if the
"audit.autoArchive.frequency" configuration parameter is set to
"monthly", the output might look like this:
database name        from date   to date     # requests
-------------        ----------  ----------  ----------
cw_audit-2017-11-30  2017-11-01  2017-11-30     986,019
cw_audit-2017-12-31  2017-12-01  2017-12-31   1,315,803
cw_audit-2018-01-31  2018-01-01  2018-01-31     922,935
cw_audit-2018-02-28  2018-02-01  2018-02-28   2,063,311
cw_audit             2018-03-01  2018-04-30   3,178,476
The "text" format (the default, shown above) is useful for producing human-readable output, the "json" format produces the same information in a JSON encoding, and a "simple" format produces a simple list of just the database names (one per line).
cwauditadmin showRequest
This will show the full details of the request specified by the
given request ID, including the details of all objects (if any) that
were served as a result of the request. If the request resulted in
an exception (either an HTTP-4xx client-side error or an HTTP-5xx
server-side error), then the full exception report is also shown.
This operation is frequently used to determine the details of an exception. When the client receives an exception report for a server-side exception, it is typically devoid of all details except for a reference number. This reference number is actually the request ID that the administrator can look up with the "cwauditadmin showRequest" operation.
cwauditadmin monitor [from=
This will monitor incoming requests (like "tail -f").
cwauditadmin listQuotas ...
cwauditadmin addQuota ...
cwauditadmin editQuota ...
cwauditadmin removeQuota ...
These commands manage user quotas. See "cwauditadmin -h" for more information.
Configuration
The following configuration parameters exist for CubeWerx Stratos Analytics.
audit.activeUsersTab.initialRefreshRate
(default value: 10 seconds)
The initial refresh rate of "Active Users" tab.
audit.activeUsersTab.initialTimeWindow
(default value: 5 minutes)
The initial time window that should be considered by "Active Users" tab.
audit.autoArchive.frequency
(default value: never)
The frequency with which to automatically archive the cw_audit database
to keep the active database to a reasonable size. If not "never",
this frequency must be the same as or a multiple of the granularities
of the request_summaries and served_summaries table (specified by the
audit.requestSummaries.granularity and audit.servedSummaries.granularity
configuration parameters respectively). Note that nothing is a multiple
of "weekly". "Bimonthly" means every two months. Everything older than
the previous time window is archived. To maintain proper consistency,
after the value of this configuration parameter is changed, the
cw_audit database should be cleared with the "cwauditadmin clear"
command. This configuration parameter is only active when the value
of the audit.keepRequestRecordsFor configuration parameter is set to
"unlimited".
audit.database.name
(default value: cw_audit)
The name of the local MySQL/MariaDB database to store auditing
information in. The username and password used to access this database
are taken from the values of the mysql.username and mysql.password
configuration parameters respectively.
audit.enable
(default value: true)
Whether or not CubeSERV should provide an audit log of its activity.
The MySQL/MariaDB database that this activity is logged to is
typically cw_audit, but can be specified as something else with
the audit.database.path configuration parameter. Note that this
is different from the "cubeserv.log" file that's enabled with the
cubeserv.enableLogging configuration parameter
audit.heatmap.defaultEqHotness
(default value: 0.7)
Equalization of the hotnesses in the area-of-interest heatmap is
controlled by three parameters: equalize (indicating whether or not
equalization should be performed, eqHotness (a target hotness, expressed
as a number from 0 to 1), and eqPercentile (a percentile of pixels,
also expressed as a number from 0 to 1). If equalization is true,
equalization is performed by calculating the hotness that eqPercentile
of the pixels is at or under (hotnessToEq), finding a gain such that
hotnessToEq * gain = eqHotness, and multiplying all hotnesses in the
heatmap by that gain.
This configuration parameter specifies the default value of the eqHotness parameter.
audit.heatmap.defaultEqPercentile
(default value: 0.9)
Equalization of the hotnesses in the area-of-interest heatmap is controlled by three parameters: equalize (indicating whether or not equalization should be performed, eqHotness (a target hotness, expressed as a number from 0 to 1), and eqPercentile (a percentile of pixels, also expressed as a number from 0 to 1). If equalization is true, equalization is performed by calculating the hotness that eqPercentile of the pixels is at or under (hotnessToEq), finding a gain such that hotnessToEq * gain = eqHotness, and multiplying all hotnesses in the heatmap by that gain.
This configuration parameter specifies the default value of the eqPercentile parameter, which in turn specifies the initial value of the gain slider in the "Area-Of-Interest Heatmap" dialog (where slider values of 0-1 are mapped to/from eqPercentile values of 1-0.2).
audit.heatmap.defaultEqualize
(default value: true)
Equalization of the hotnesses in the area-of-interest heatmap is controlled by three parameters: equalize (indicating whether or not equalization should be performed, eqHotness (a target hotness, expressed as a number from 0 to 1), and eqPercentile (a percentile of pixels, also expressed as a number from 0 to 1). If equalization is true, equalization is performed by calculating the hotness that eqPercentile of the pixels is at or under (hotnessToEq), finding a gain such that hotnessToEq * gain = eqHotness, and multiplying all hotnesses in the heatmap by that gain.
This configuration parameter specifies the default value of the equalize parameter.
audit.heatmap.initialLonLatCenter
(default value: 0,34)
The point that the area-of-interest heatmap should initially be centered on, of the form lon,lat.
audit.heatmap.initialMaxOpacity
(default value: 0.8)
The initial maximum-opacity level of the area-of-interest heatmap (from 0 to 1).
audit.heatmap.initialVaryOpacity
(default value: true)
Whether or not "vary opacity" is initially selected in the area-of-interest heatmap.
audit.heatmap.initialZoom
(default value: 1)
The initial zoom level of the area-of-interest heatmap (from 0 to 30).
audit.heatmap.olBaseLayerCode
(default value: new ol.layer.Tile({source: new ol.source.OSM()}))
The OpenLayers 9 layer that should be used as a base layer in the area-of-interest heatmap. This should be JavaScript code that evaluates to an object that's of a subclass of ol.layer.Base that uses a Spherical Mercator (EPSG:3857) projection. Use caution, since this code will be injected into the client-side environment and blindly evaluated.
audit.keepRequestRecordsFor
(default value: 1 year)
The minimum amount of time that request and served-object records should be kept in the CubeWerx Stratos Analytics databases before being purged. A value of "unlimited" specifies that they should be kept forever, in which case they are archived according to the value of the audit.autoArchive.frequency configuration parameter.
audit.maxDatabaseAccessTime
(default value: 5 minutes)
The maximum amount of time that CubeWerx Stratos Analytics will spend accessing the database before aborting. This is to prevent degenerate cases from spinning indefinitely and using an unbounded amount of resources. A value of "unlimited" specifies that no limit should be imposed. Note that this parameter is currently only fully enforced when using MariaDB 10.1.2 and up.
audit.monitor.pollInterval
(default value: 1 second)
The amount of time the "cwauditadmin monitor" command will wait between
polls to the cw_audit database. Note that there will also be a slight
lag due to the frequency at which the database updates are flushed
(specified by the value of the audit.daemon.flushInterval configuration
parameter).
audit.nAcceptable5xxErrorsPerHour
(default value: unlimited)
The maximum number of HTTP 5xx errors that are acceptable per hour
in the cw_audit database. Whenever the frequency of HTTP 5xx errors
exceeds this, an e-mail message will be sent to the e-mail address
specified by the stratos.supportAddress configuration parameter warning
of the situation. A value of "unlimited" disables this check.
audit.quotas.warning1.enable
(default value: true)
Whether or not a warning e-mail messsage should be sent to a user
when he/she reaches the percentage of used quota specified by the
audit.quotas.warning1.sendAtPercentage configuration parameter.
audit.quotas.warning1.sendAtPercentage
(default value: 75)
The percentage of used quota at which a user should be sent the first
warning e-mail message (subject to the audit.quotas.warning1.enable
configuration parameter).
audit.quotas.warning2.enable
(default value: true)
Whether or not a warning e-mail messsage should be sent to a user
when he/she reaches the percentage of used quota specified by the
audit.quotas.warning2.sendAtPercentage configuration parameter.
audit.quotas.warning2.sendAtPercentage
(default value: 90)
The percentage of used quota at which a user should be sent the second
warning e-mail message (subject to the audit.quotas.warning2.enable
configuration parameter).
audit.quotas.warning3.enable
(default value: true)
Whether or not a warning e-mail messsage should be sent to a user
when he/she reaches the percentage of used quota specified by the
audit.quotas.warning3.sendAtPercentage configuration parameter.
audit.quotas.warning3.sendAtPercentage
(default value: 100)
The percentage of used quota at which a user should be sent the third
warning e-mail message (subject to the audit.quotas.warning3.enable
configuration parameter).
audit.quotas.warningSubject
(default value: @en;quota warning@fr;avertissement de quota)
The subject to use for the e-mail message that gets sent when a user
reaches one of the configured quota thresholds. Multilingual syntax
can be used to indicate the language of the subject and to specify the
subject in multiple languages.
audit.quotas.enable
(default value: false)
Whether or not quotas on CubeSERV activity should be enabled.
audit.report.averageOverWeekdaysOnly
(default value: true)
Whether just weekdays (i.e., Monday through Friday) versus all seven
days of the week should be included in the averages reported by the
"Time-Of-Day Average Usage" tables in the "Report" tab.
audit.report.maxCities
(default value: 10)
The maximum number of entries to show in the "Top Cities" tables in the
"Report" tab. A value of "0" inhibits the display of the "Top Cities"
tables, and a value of "unlimited" indicates that the tables should be as
long as necessary to show all cities. Note that a MaxMind database needs
to be installed on the system for these tables to be displayed. See the
audit.report.geoip.mmdbPath configuration parameter for more details.
audit.report.maxCoarseComparisonsOverTime
(default value: 24)
The maximum number of entries to show in the "Monthly Comparisons"
tables in the "Report" tab. A value of "0" inhibits the display of the
"Monthly Comparisons" tables, and a value of "unlimited" indicates that
the tables should be as long as necessary to show comparisons for the
entire range of available data. Note that these tables may instead
be called "Weekly Comparisons", etc., depending on the value of the
audit.summaries.granularity configuration parameter.
audit.report.maxCountries
(default value: 10)
The maximum number of entries to show in the "Top Countries" tables
in the "Report" tab. A value of "0" inhibits the display of the "Top
Countries" tables, and a value of "unlimited" indicates that the tables
should be as long as necessary to show all countries. Note that a
MaxMind database needs to be installed on the system for these tables
to be displayed. See the audit.report.geoip.mmdbPath configuration
parameter for more details.
audit.report.maxCoverages
(default value: 10)
The maximum number of entries to show in the "Top Coverages" tables
in the "Report" tab. A value of "0" inhibits the display of the "Top
Coverages" tables, and a value of "unlimited" indicates that the tables
should be as long as necessary to show all coverages.
audit.report.maxFeatureSets
(default value: 10)
The maximum number of entries to show in the "Top Feature Sets" tables
in the "Report" tab. A value of "0" inhibits the display of the "Top
Feature Sets" tables, and a value of "unlimited" indicates that the
tables should be as long as necessary to show all feature sets.
audit.report.maxHosts
(default value: 10)
The maximum number of entries to show in the "Top Hosts" tables in the
"Report" tab. A value of "0" inhibits the display of the "Top Hosts"
tables, and a value of "unlimited" indicates that the tables should be
as long as necessary to show all hosts.
audit.report.maxLayers
(default value: 10)
The maximum number of entries to show in the "Top Layers" tables in the
"Report" tab. A value of "0" inhibits the display of the "Top Layers"
tables, and a value of "unlimited" indicates that the tables should be
as long as necessary to show all layers.
audit.report.maxOperations
(default value: 10)
The maximum number of entries to show in the "Top Operations" tables
in the "Report" tab. A value of "0" inhibits the display of the "Top
Operations" tables, and a value of "unlimited" indicates that the tables
should be as long as necessary to show all operations.
audit.report.maxUsernames
(default value: 10)
The maximum number of entries to show in the "Top Usernames" tables
in the "Report" tab. A value of "0" inhibits the display of the "Top
Usernames" tables, and a value of "unlimited" indicates that the tables
should be as long as necessary to show all usernames.
audit.report.geoip.accountId
(default value: )
A MaxMind account ID. Supply both this and audit.report.geoip.licenseKey
in order for the geoip_update.sh cron job to automatically download
the MaxMind GeoLite2 City database and keep it up to date. A MaxMind
account can be created at "https://www.maxmind.com/en/geolite2/signup".
audit.report.geoip.licenseKey
(default value: )
A MaxMind license key. Supply both this and
audit.report.geoip.accountId in order for the geoip_update.sh cron
job to automatically download the MaxMind GeoLite2 City database
and keep it up to date. A MaxMind account can be created at
"https://www.maxmind.com/en/geolite2/signup" and a license key can be
generated at "https://www.maxmind.com/en/accounts/current/license-key".
audit.report.geoip.mmdbPath
(default value: share/geoip/GeoLite2-City.mmdb)
The path (either absolute or relative to $CW_HOME) to a recent
MaxMind GeoLite2 City database (in MaxMind DB format), or to an
equivalent Paid GeoIP database. If the audit.report.geoip.accountId
and audit.report.geoip.licenseKey configuration parameters are set
appropriately, the geoip_update.sh cron job will automatically
download the database (to its default path) and keep it up
to date. However, it can also be manually downloaded from
"https://www.maxmind.com/en/accounts/current/geoip/downloads".
audit.report.showDayOfWeekAverages
(default value: true)
Whether or not to show the "Day-Of-Week Average Usage" tables in the
"Report" tab.
audit.report.showTimeOfDayAverages
(default value: true)
Whether or not to show the "Time-Of-Day Average Usage" tables
in the "Report" tab. A separate configuration parameter,
audit.report.averageOverWeekdaysOnly, specifies whether just weekdays
versus all seven days of the week should be included in the averages.
audit.requestIdBatchFilename
(default value: requestIdBatch.txt)
Request IDs are assigned in batches (with the cw_audit database as
the central authority) to allow them to be efficiently but uniquely
assigned in multi-server environments. This configuration parameter
specifies the local file that a server uses to keep track of the batch
it has been assigned. It can be an absolute path or just a filename
(in which case it'll be put in $CW_HOME/logs).
audit.requestIdBatchSize
(default value: 1000)
Request IDs are assigned in batches (with the cw_audit database as
the central authority) to allow them to be efficiently but uniquely
assigned in multi-server environments. This configuration parameter
specifies the size of each batch.
audit.requests.enable
(default value: true)
Whether or not to provide an audit-log entry for every request in the requests table of the cw_audit database (assuming auditing is enabled with the audit.enable configuration parameter). The requests table can get very large very quickly on a busy system. To help manage this, it's possible to configure, via the audit.requests.logOperations and audit.requests.exceptOperations configuration parameters, which types of request get logged. Note that the request_summaries table (if enabled) always includes all requests, regardless as to which requests (if any) are individually logged into the requests table. If you wish to also log specific information about each layer, coverage or feature set served in response to each request, you must also enable the audit.servedObjects.enable configuration parameter.
audit.requests.exceptOperation
(default value:)
A whitespace-separated list of the operations (expressed as service:operation) that should be excluded from being logged into the requests table of the cw_audit database. A wildcard ("*") can be specified for the service and/or operation, and a wildcard by itself means everything. A request is logged if its operation is listed in the value of the audit.requests.logOperations configuration parameter and is not listed in the value of the this configuration parameter.
audit.requests.logOperations
(default value: *)
A whitespace-separated list of the operations (expressed as service:operation) that should be logged into the requests table of the cw_audit database. A wildcard ("*") can be specified for the service and/or operation, and a wildcard by itself means everything. A request is logged if its operation is listed in the value of this configuration parameter and is not listed in the value of the audit.requests.exceptOperations configuration parameter.
audit.servedObjects.enable
(default value: true)
Whether or not to provide an audit-log entry for every served layer, coverage or feature set in the served_objects table of the cw_audit database (assuming auditing is enabled with the audit.enable configuration parameter and the requests table is enabled with the audit.requests.enable configuration parameter). A served object is only logged if the corresponding request is logged. Since some requests can be for more than one object at a time, there can be a one-to-many mapping between a request and a served object. Some requests may be without any corresponding requested objects. Be aware that the served_objects table can get very large very quickly on a busy system.
audit.sqlBufferFilename
(default value: audit_buffer.sql)
For efficiency, CubeSERV doesn't log its activity directly to the
cw_audit database (unless the value of the audit.daemon.flushFrequency
configuration parameter is set to 0, in which case it does). Instead,
it buffers the appropriate SQL statements to a local file, the contents
of which get periodically flushed to the database by cwauditd. This
configuration parameter specifies the local file that the SQL statements
get buffered to. It can be an absolute path or just a filename (in
which case it'll be put in $CW_HOME/logs). In a load-balanced system
where multiple CubeWerx Stratos installations share a single mounted
$CW_HOME, this configuration parameter must be adjusted to point to a
location that's local to each instance.
audit.summaries.enable
(default value: true)
Whether or not the request_summaries and served_summaries tables of
the cw_audit database should be active (assuming auditing is enabled
with the audit.enable configuration parameter). The request_summaries
table provides a summary of all requests, and the served_summaries table
provides a summary of all served layers, coverages and feature sets.
These summaries are collected at the granularity specified by the
audit.summaries.granularity configuration parameter.
audit.summaries.granularity
(default value: monthly)
The granularity with which to summarize requests in the
request_summaries table and served layers, coverages and feature sets in
the served_summaries table of the cw_audit database. This granularity
must be the same as or or evenly divisible by the auto-archive frequency
(specified by the audit.autoArchive.frequency configuration parameter).
Note that nothing is a multiple of "weekly". "Bimonthly" means every
two months.
audit.title
(default value: @en;CubeWerx Stratos Analytics)
The displayed title of the CubeWerx Stratos Analytics web application.
Multilingual syntax can be used to indicate the language of the title
and to specify the title in multiple languages.
audit.userAgents.enable
(default value: true)
Whether or not the user_agents table of the cw_audit database should be active (assuming auditing is enabled with the audit.enable configuration parameter). This table provides a summary of the user agents (e.g., Firefox, Internet Explorer) that are making the requests.
The cwauditd Daemon
Unless configured otherwise, CubeSERV doesn't write directly to the cw_audit database. For maximum performance and scaleability, it instead buffers the log entries locally, and a cwauditd daemon flushes the entries to the database once per second. This behaviour can be tuned with the following global configuration parameters:
audit.daemon.flushInterval
(default value: 1 second)
The frequency at which cwauditd flushes the SQL statements from the
file specified by the audit.sqlBufferFilename configuration parameter
to the cw_audit database. A value of 0 disables the buffer mechanism,
in which case CubeSERV will log its activity directly to the cw_audit
database. After the value of this configuration parameter has been
changed, cwauditd needs to be restarted with the command "cwauditd
restart -q &".
audit.daemon.lockFilename
(default value: cwauditd.pid)
The file that cwauditd uses to ensure that only one of them is running
as a daemon at a time. It can be an absolute path or just a filename
(in which case it'll be put in $CW_HOME/logs). After the value of this
configuration parameter has been changed, cwauditd needs to be restarted
with the command "cwauditd restart -q &". In a load-balanced system
where multiple CubeWerx Stratos installations share a single mounted
$CW_HOME, this configuration parameter must be adjusted to point to a
location that's local to each instance.
audit.daemon.logFilename
(default value: cwauditd.log)
The name of the file (in the $CW_HOME/logs directory) that cwauditd
should log its activity to. After the value of this configuration
parameter has been changed, cwauditd needs to be restarted with the
command "cwauditd restart -q &".
audit.daemon.maxStatementsPerTransaction
(default value: 200)
The maximum number of SQL statements that cwauditd should bundle into
a single transaction when flushing a batch of SQL statements to the
database. A value of "unlimited" specifies that the entire batch of SQL
statement should be bundled into a single transaction regardless of its
size. After the value of this configuration parameter has been changed,
cwauditd needs to be restarted with the command "cwauditd restart -q &".
audit.daemon.niceness
(default value: 0)
The 'nice' level of cwauditd. After the value of this configuration
parameter has been changed, cwauditd needs to be restarted with the
command "cwauditd restart -q &".